
In this post
In part 1 I got my Vaillant EcoCompact talking to Home Assistant through an eBUS adapter, ebusd and MQTT. The result was a device page with a long list of ebusd_bai_* sensors and one card with four gauges.
That’s data, but not something you can read in two seconds. This part is about the dashboard: what I put on it, what I left out, and a couple of tricks that made it more useful than the boiler’s own display.
What I wanted to see
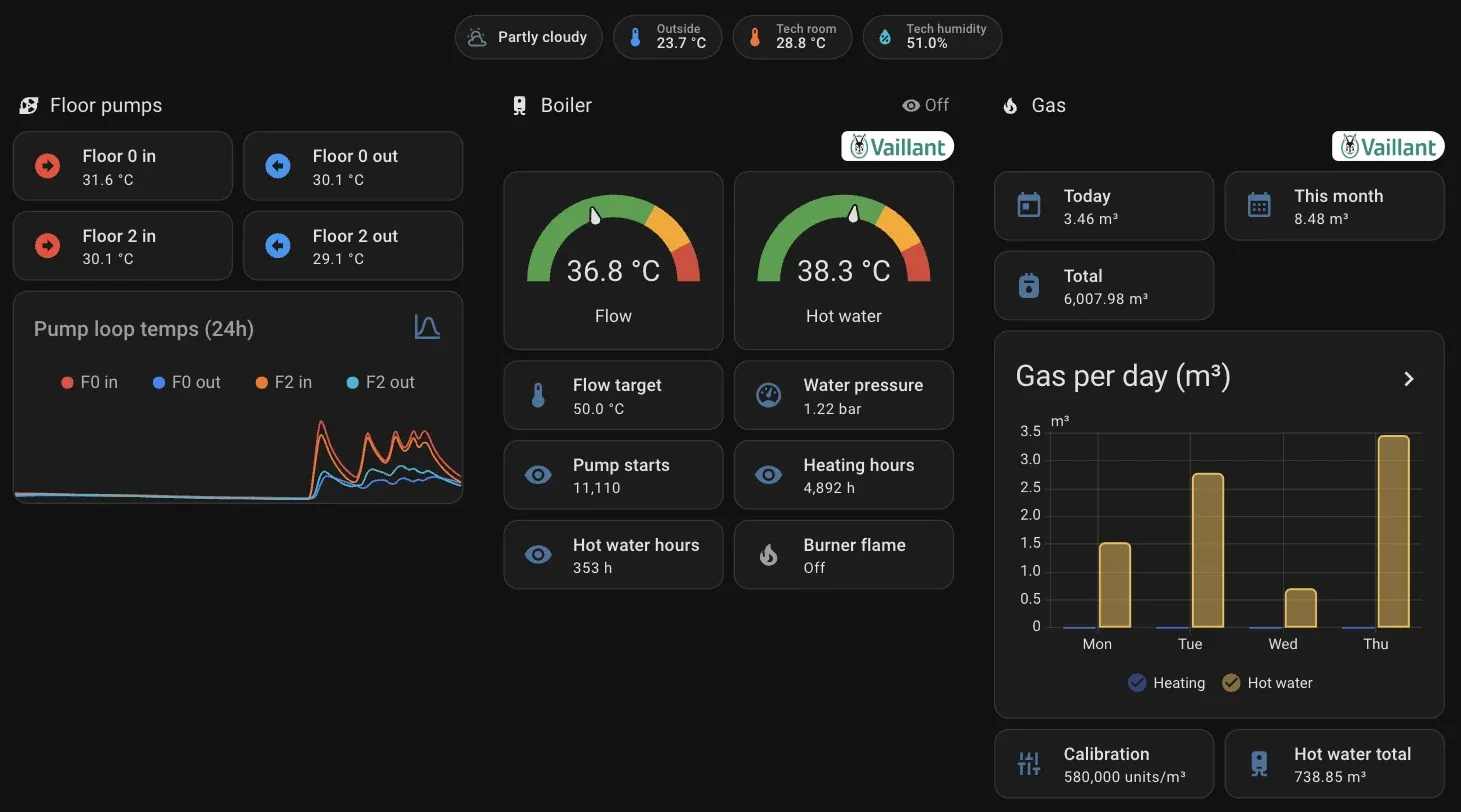
Heating in my house is more than the boiler. There are circulation pumps for two floors, ten rooms with their own thermostats, and a gas bill at the end of the month. So the Heating view is split into sections that answer one question each:
- Are the floor pump loops actually moving heat?
- What is the boiler doing right now?
- How much gas am I burning, and on what?
- Which rooms are asking for heat?
- How do room temperatures follow the weather?
The view uses the sections layout with up to four columns. At the top sit four badges: the weather, outside temperature, and the temperature and humidity in the tech room.
Floor pumps
An ESP32 in the tech room, running ESPHome, reads temperature probes on the inlet and outlet of the floor 0 and floor 2 pump loops.
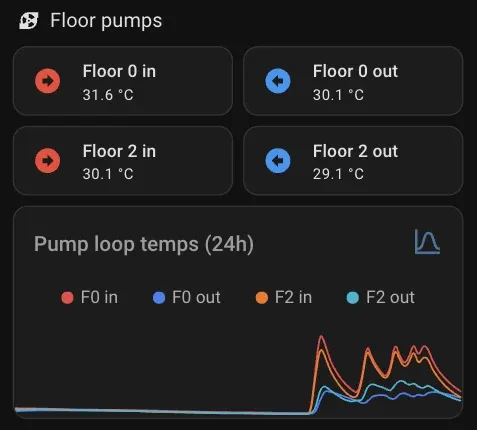
The four tiles give the current values, and a mini-graph-card underneath shows all four lines over the last 24 hours. The gap between “in” and “out” is the interesting part. When the two lines sit on top of each other, the loop is circulating but not delivering heat anywhere.
type: custom:mini-graph-card
name: Pump loop temps (24h)
hours_to_show: 24
points_per_hour: 4
entities:
  - sensor.esp32_tech_multisensor_floor_0_pump_inlet_temperature
  - sensor.esp32_tech_multisensor_floor_0_pump_outlet_temperature
  - sensor.esp32_tech_multisensor_floor_2_pump_inlet_temperature
  - sensor.esp32_tech_multisensor_floor_2_pump_outlet_temperature
Boiler
This is the section built on part 1. Two gauges for flow temperature and hot water, then tiles for the flow target, water pressure, pump starts, heating hours, hot water hours and whether the burner flame is on.
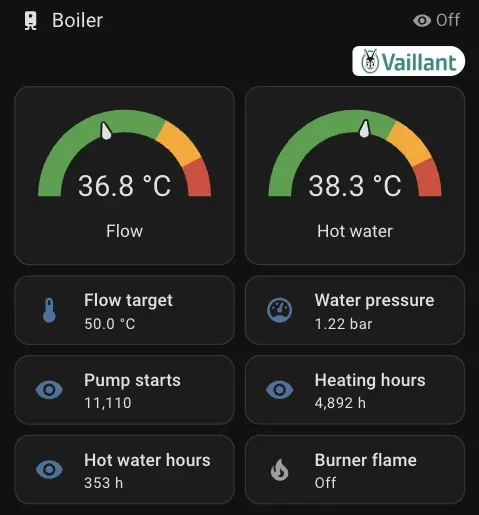
The gauges have a needle and severity bands, so a glance is enough to tell normal from hot:
type: gauge
entity: sensor.ebusd_bai_flowtemp_temp
name: Flow
min: 0
max: 90
needle: true
severity:
  green: 0
  yellow: 59.4
  red: 76.5
The heading also carries a badge with the circulation pump state, the small “Off” in the corner.
The part I like most is what happens when the eBUS adapter loses the boiler. Every card in this section has a visibility condition on binary_sensor.ebusd_global_signal. When the signal drops, the gauges disappear and a markdown card shows up in their place saying there is no eBUS signal and to check the adapter wiring or power. A dashboard full of “unavailable” tiles tells you something is broken. This one tells you what.
type: markdown
visibility:
  - condition: state
    entity: binary_sensor.ebusd_global_signal
    state_not: "on"
content: |
  ### ⚠️ No eBUS signal
  The ebusd adapter is running but isn't receiving data from the boiler...
The Vaillant logo in the corner is a picture card pointing at the Home Assistant brands image, trimmed with card_mod so it sits flat next to the heading.
Gas, without a gas meter
My gas meter isn’t connected to anything. But the boiler keeps its own counters, and ebusd exposes them: prenergysumhc1 for heating and prenergysumhwc1 for hot water. They are big raw numbers that only mean something once you divide them by the right factor.
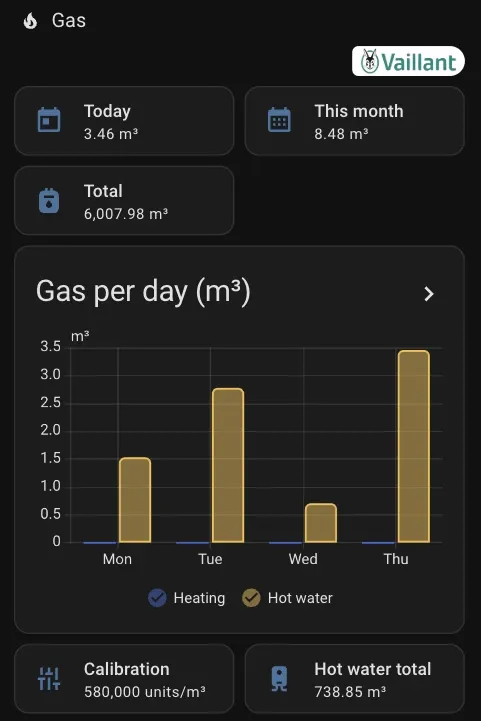
So gas usage comes from three template sensors, which I created as template helpers in the UI:
# Boiler gas total
{{ ((states('sensor.ebusd_bai_prenergysumhc1')|float
   + states('sensor.ebusd_bai_prenergysumhwc1')|float)
   / states('input_number.boiler_gas_calibration')|float(580000)) | round(3) }}

# Boiler gas heating
{{ (states('sensor.ebusd_bai_prenergysumhc1')|float
   / states('input_number.boiler_gas_calibration')|float(580000)) | round(3) }}
The hot water one is the same with hwc1. All three use device_class: gas, unit m³ and state_class: total_increasing, which means Home Assistant keeps long-term statistics for them and they can go into the Energy dashboard too.
The divisor lives in an input_number instead of being hardcoded, currently 580,000 units per m³. If the numbers drift from the real meter, I change one value on the dashboard and every gas sensor follows. No editing templates.
On top of the total, two utility_meter helpers give “today” and “this month”. The chart is a statistics-graph with stat_types: change, one bar per day for heating and one for hot water:
type: statistics-graph
title: Gas per day (m³)
chart_type: bar
period: day
days_to_show: 14
stat_types:
  - change
entities:
  - entity: sensor.boiler_gas_heating
    name: Heating
  - entity: sensor.boiler_gas_hot_water
    name: Hot water
It’s September, so the heating bars are flat and everything is hot water for now. That split is exactly why I wanted it. Once the heating season starts, I’ll see how much of the bill is showers and how much is keeping the house warm.
Thermostats and rooms
Every room has a Tuya Zigbee thermostat, integrated with LocalTuya, so there are ten climate entities. Each gets a tile with the current temperature and +/− buttons for the setpoint.
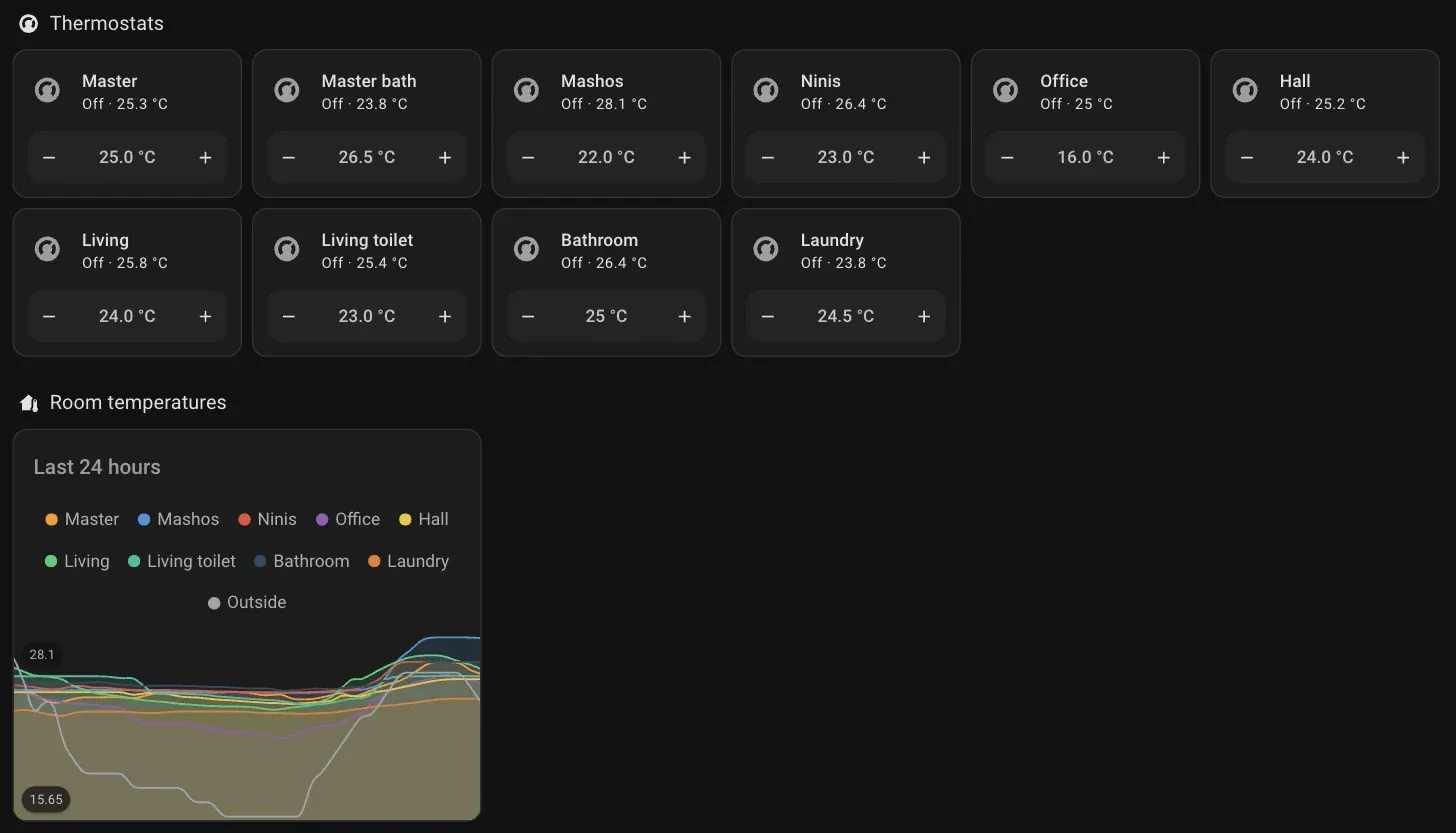
Two entity-filter cards sit above them and stay hidden most of the time. The first is a “Heating now” glance card that only lists thermostats in the heat state, so in winter I can see at once which rooms are calling for heat. The second lists the thermostats’ fault sensors and only appears if one of them turns on.
type: entity-filter
conditions:
  - condition: state
    state: heat
card:
  type: glance
  title: Heating now
  show_state: true
entities:
  - climate.master_thermostat
  - climate.living_heating
  # ...the other eight
Below that, one more mini-graph-card draws every room plus the outside temperature over 24 hours. Outside dropped to around 16 °C overnight while the rooms stayed between 23 and 28 °C. That’s the kind of thing you only notice when it’s all on one graph.
The full dashboard code
Here is the whole Heating view as YAML. To use it, add an empty view to your dashboard, open its settings in edit mode, choose “Edit in YAML” from the three-dot menu and paste this in. It uses two cards from HACS: mini-graph-card for the graphs and card-mod for the Vaillant logo styling. The entity names are mine, so swap in your own ebusd, thermostat and sensor entities.
type: sections
title: Heating
path: heating
icon: mdi:heating-coil
max_columns: 4
badges:
- type: entity
  entity: weather.openweathermap
  show_name: false
  show_state: true
  show_icon: true
- type: entity
  entity: sensor.openweathermap_temperature
  name: Outside
  show_name: true
  color: blue
- type: entity
  entity: sensor.esp32_tech_multisensor_tech_room_temperature
  name: Tech room
  show_name: true
  color: deep-orange
- type: entity
  entity: sensor.esp32_tech_multisensor_tech_room_humidity
  name: Tech humidity
  show_name: true
  color: cyan
sections:
- type: grid
  cards:
  - type: heading
    heading: Floor pumps
    icon: mdi:pump
  - type: tile
    entity: sensor.esp32_tech_multisensor_floor_0_pump_inlet_temperature
    name: Floor 0 in
    grid_options:
      columns: 6
    icon: mdi:arrow-right-bold-circle
    color: red
  - type: tile
    entity: sensor.esp32_tech_multisensor_floor_0_pump_outlet_temperature
    name: Floor 0 out
    grid_options:
      columns: 6
    icon: mdi:arrow-left-bold-circle
    color: blue
  - type: tile
    entity: sensor.esp32_tech_multisensor_floor_2_pump_inlet_temperature
    name: Floor 2 in
    grid_options:
      columns: 6
    icon: mdi:arrow-right-bold-circle
    color: red
  - type: tile
    entity: sensor.esp32_tech_multisensor_floor_2_pump_outlet_temperature
    name: Floor 2 out
    grid_options:
      columns: 6
    icon: mdi:arrow-left-bold-circle
    color: blue
  - type: custom:mini-graph-card
    name: Pump loop temps (24h)
    icon: mdi:chart-bell-curve
    hours_to_show: 24
    points_per_hour: 4
    line_width: 2
    animate: true
    show:
      fill: false
      labels: false
      extrema: false
      state: false
    entities:
    - entity: sensor.esp32_tech_multisensor_floor_0_pump_inlet_temperature
      name: F0 in
      color: '#ef4444'
    - entity: sensor.esp32_tech_multisensor_floor_0_pump_outlet_temperature
      name: F0 out
      color: '#3b82f6'
    - entity: sensor.esp32_tech_multisensor_floor_2_pump_inlet_temperature
      name: F2 in
      color: '#f97316'
    - entity: sensor.esp32_tech_multisensor_floor_2_pump_outlet_temperature
      name: F2 out
      color: '#06b6d4'
- type: grid
  cards:
  - type: heading
    heading: Boiler
    icon: mdi:water-boiler
    badges:
    - type: entity
      entity: sensor.ebusd_bai_status01_pumpstate
      show_state: true
      show_icon: true
      visibility:
      - condition: state
        entity: binary_sensor.ebusd_global_signal
        state: 'on'
  - type: picture
    image: https://brands.home-assistant.io/mypyllant/logo.png
    grid_options:
      columns: 12
      rows: auto
    card_mod:
      style: ha-card{background:none;border:none;box-shadow:none;display:flex;justify-content:flex-end;align-items:center;height:26px;overflow:visible} img{width:auto !important;height:20px !important;object-fit:contain;background:#fff;padding:2px
        7px;border-radius:5px;box-sizing:content-box}
  - type: markdown
    visibility:
    - condition: state
      entity: binary_sensor.ebusd_global_signal
      state_not: 'on'
    content: |-
      ### ⚠️ No eBUS signal
      The ebusd adapter is running but isn't receiving data from the boiler, so boiler readings are unavailable. Check the adapter wiring / power. Readings will appear here automatically when the signal is back.
  - type: gauge
    entity: sensor.ebusd_bai_flowtemp_temp
    name: Flow
    min: 0
    max: 90
    needle: true
    severity:
      green: 0
      yellow: 59.4
      red: 76.5
    visibility:
    - condition: state
      entity: binary_sensor.ebusd_global_signal
      state: 'on'
    grid_options:
      columns: 6
  - type: gauge
    entity: sensor.ebusd_bai_hwctemp_temp
    name: Hot water
    min: 0
    max: 70
    needle: true
    severity:
      green: 0
      yellow: 46.2
      red: 59.5
    visibility:
    - condition: state
      entity: binary_sensor.ebusd_global_signal
      state: 'on'
    grid_options:
      columns: 6
  - type: tile
    entity: sensor.ebusd_bai_flowtempdesired
    name: Flow target
    grid_options:
      columns: 6
    visibility:
    - condition: state
      entity: binary_sensor.ebusd_global_signal
      state: 'on'
  - type: tile
    entity: sensor.ebusd_bai_waterpressure_press
    name: Water pressure
    grid_options:
      columns: 6
    visibility:
    - condition: state
      entity: binary_sensor.ebusd_global_signal
      state: 'on'
    icon: mdi:gauge
  - type: tile
    entity: sensor.ebusd_bai_hcpumpstarts
    name: Pump starts
    grid_options:
      columns: 6
    visibility:
    - condition: state
      entity: binary_sensor.ebusd_global_signal
      state: 'on'
  - type: tile
    entity: sensor.ebusd_bai_hchours
    name: Heating hours
    grid_options:
      columns: 6
    visibility:
    - condition: state
      entity: binary_sensor.ebusd_global_signal
      state: 'on'
  - type: tile
    entity: sensor.ebusd_bai_hwchours
    name: Hot water hours
    grid_options:
      columns: 6
    visibility:
    - condition: state
      entity: binary_sensor.ebusd_global_signal
      state: 'on'
  - type: tile
    entity: sensor.ebusd_bai_flame
    name: Burner flame
    grid_options:
      columns: 6
    visibility:
    - condition: state
      entity: binary_sensor.ebusd_global_signal
      state: 'on'
    icon: mdi:fire
- type: grid
  cards:
  - type: heading
    heading: Gas
    icon: mdi:fire
  - type: picture
    image: https://brands.home-assistant.io/mypyllant/logo.png
    grid_options:
      columns: 12
      rows: auto
    card_mod:
      style: ha-card{background:none;border:none;box-shadow:none;display:flex;justify-content:flex-end;align-items:center;height:26px;overflow:visible} img{width:auto !important;height:20px !important;object-fit:contain;background:#fff;padding:2px
        7px;border-radius:5px;box-sizing:content-box}
  - type: tile
    entity: sensor.boiler_gas_today
    name: Today
    icon: mdi:calendar-today
    grid_options:
      columns: 4
  - type: tile
    entity: sensor.boiler_gas_this_month
    name: This month
    icon: mdi:calendar-month
    grid_options:
      columns: 4
  - type: tile
    entity: sensor.boiler_gas_total
    name: Total
    icon: mdi:meter-gas
    grid_options:
      columns: 4
  - type: statistics-graph
    title: Gas per day (m³)
    entities:
    - entity: sensor.boiler_gas_heating
      name: Heating
    - entity: sensor.boiler_gas_hot_water
      name: Hot water
    stat_types:
    - change
    period: day
    chart_type: bar
    days_to_show: 14
    hide_legend: false
    grid_options:
      columns: 12
      rows: 5
  - type: tile
    entity: input_number.boiler_gas_calibration
    name: Calibration
    features: []
    grid_options:
      columns: 6
  - type: tile
    entity: sensor.boiler_gas_hot_water
    name: Hot water total
    icon: mdi:water-boiler
    grid_options:
      columns: 6
- type: grid
  column_span: 3
  cards:
  - type: heading
    heading: Thermostats
    icon: mdi:thermostat
  - type: entity-filter
    entities:
    - entity: climate.master_thermostat
      name: Master
    - entity: climate.master_bathroom_heating
      name: Master bath
    - entity: climate.mashos_thermostat
      name: Mashos
    - entity: climate.ninis_thermostat
      name: Ninis
    - entity: climate.office_thermostat
      name: Office
    - entity: climate.hall_thermostat
      name: Hall
    - entity: climate.living_heating
      name: Living
    - entity: climate.living_toilet_heating
      name: Living toilet
    - entity: climate.bathroom_heating
      name: Bathroom
    - entity: climate.laundry_thermostat
      name: Laundry
    conditions:
    - condition: state
      state: heat
    card:
      type: glance
      title: Heating now
      show_state: true
    show_empty: false
  - type: tile
    entity: climate.master_thermostat
    name: Master
    grid_options:
      columns: 6
    features:
    - type: target-temperature
    features_position: bottom
  - type: tile
    entity: climate.master_bathroom_heating
    name: Master bath
    grid_options:
      columns: 6
    features:
    - type: target-temperature
    features_position: bottom
  - type: tile
    entity: climate.mashos_thermostat
    name: Mashos
    grid_options:
      columns: 6
    features:
    - type: target-temperature
    features_position: bottom
  - type: tile
    entity: climate.ninis_thermostat
    name: Ninis
    grid_options:
      columns: 6
    features:
    - type: target-temperature
    features_position: bottom
  - type: tile
    entity: climate.office_thermostat
    name: Office
    grid_options:
      columns: 6
    features:
    - type: target-temperature
    features_position: bottom
  - type: tile
    entity: climate.hall_thermostat
    name: Hall
    grid_options:
      columns: 6
    features:
    - type: target-temperature
    features_position: bottom
  - type: tile
    entity: climate.living_heating
    name: Living
    grid_options:
      columns: 6
    features:
    - type: target-temperature
    features_position: bottom
  - type: tile
    entity: climate.living_toilet_heating
    name: Living toilet
    grid_options:
      columns: 6
    features:
    - type: target-temperature
    features_position: bottom
  - type: tile
    entity: climate.bathroom_heating
    name: Bathroom
    grid_options:
      columns: 6
    features:
    - type: target-temperature
    features_position: bottom
  - type: tile
    entity: climate.laundry_thermostat
    name: Laundry
    grid_options:
      columns: 6
    features:
    - type: target-temperature
    features_position: bottom
  - type: entity-filter
    entities:
    - entity: binary_sensor.master_thermostat_fault
      name: Master fault
    - entity: binary_sensor.mashos_thermostat_fault
      name: Mashos fault
    - entity: binary_sensor.ninis_thermostat_fault
      name: Ninis fault
    - entity: binary_sensor.office_thermostat_fault
      name: Office fault
    - entity: binary_sensor.hall_thermostat_fault
      name: Hall fault
    - entity: binary_sensor.living_heating_fault
      name: Living fault
    - entity: binary_sensor.living_toilet_heating_fault
      name: Living toilet fault
    - entity: binary_sensor.bathroom_heating_fault
      name: Bathroom fault
    - entity: binary_sensor.laundry_thermostat_fault
      name: Laundry fault
    conditions:
    - condition: state
      state: 'on'
    card:
      type: entities
      title: ⚠️ Thermostat faults
    show_empty: false
- type: grid
  column_span: 3
  cards:
  - type: heading
    heading: Room temperatures
    icon: mdi:home-thermometer
  - type: custom:mini-graph-card
    name: Last 24 hours
    hours_to_show: 24
    points_per_hour: 2
    line_width: 2
    animate: true
    height: 200
    show:
      labels: true
      extrema: false
      state: false
      icon: false
      legend: true
    entities:
    - entity: sensor.master_thermostat_external_temperature
      name: Master
    - entity: sensor.mashos_thermostat_external_temperature
      name: Mashos
    - entity: sensor.ninis_thermostat_external_temperature
      name: Ninis
    - entity: sensor.office_thermostat_external_temperature
      name: Office
    - entity: sensor.hall_thermostat_external_temperature
      name: Hall
    - entity: sensor.living_heating_external_temperature
      name: Living
    - entity: sensor.living_toilet_heating_external_temperature
      name: Living toilet
    - entity: sensor.bathroom_heating_external_temperature
      name: Bathroom
    - entity: sensor.laundry_thermostat_external_temperature
      name: Laundry
    - entity: sensor.openweathermap_temperature
      name: Outside
      color: '#9ca3af'
      show_fill: false
Wrapping up
The boiler data from part 1 was already there. The dashboard is what made it useful: the floor loops, the boiler, gas and every room on one screen, with warnings that only show up when something is wrong.
Part 1 ended with plans for automations and predictive heating. With the dashboard in place, that’s next.
Follow along. New posts show up on the RSS feed. I also share my projects on GitHub, MakerWorld and LinkedIn.