
In this post

fusionsolar-exporter
Huawei FusionSolar plant and inverter metrics for Prometheus and Grafana.
Works with a normal FusionSolar web login. No Northbound API account needed.
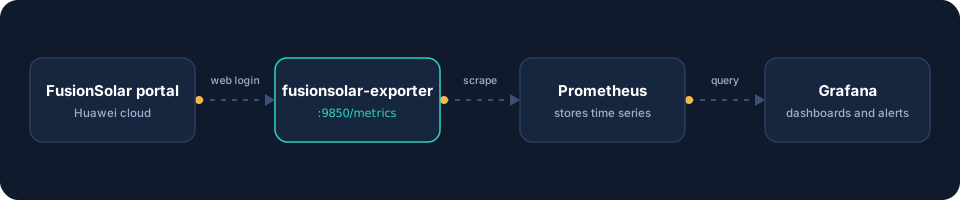
I look after monitoring for a few solar plants. Some run Fronius inverters, which I already had in Grafana. The rest run Huawei SUN2000 inverters, and those only showed up in one place: the FusionSolar web portal.
The portal is fine for a quick look. It is not fine when you want every inverter on one screen next to the others, your own alerts, and more history than the portal is willing to show you. I wanted the Huawei numbers in the same Grafana dashboard as everything else.
So I wrote fusionsolar-exporter and put it on GitHub.
First, what is an exporter
Prometheus is an open source monitoring system. It does one simple thing very well: every minute or so it visits a list of HTTP addresses, reads the numbers it finds there, and stores them as time series. Grafana then draws those series.
The catch is that the thing you want to monitor has to publish its numbers in the Prometheus text format. An inverter cloud portal does not do that. This is where an exporter comes in. It is a small translator that sits between Prometheus and the system that does not speak its language. It reads the data from the source, however the source wants to be read, and serves it on a /metrics page that looks like this:
fusionsolar_station_active_power_kw{station_name="Plant A"} 41.5
fusionsolar_inverter_temperature_celsius{device_name="INV-1"} 38.2
There are exporters for almost everything: Linux hosts, databases, firewalls, UPSes. Now there is one more for FusionSolar.
The official way, and why I could not use it
Huawei has an official interface called the Northbound API. It was my first choice and the first version of the exporter used it. Then I hit the wall: the Northbound API needs its own API account, and only a company administrator can create one in the portal. I had a regular web user and nothing else. The login came back with failCode=20400 and that was the end of that.
Even when you can get an API account, it is limited to about one request every five minutes per endpoint.
The other way: do what the browser does
The portal is a single page app. Everything it shows comes from JSON endpoints behind it. With the browser dev tools open on the Network tab, it took a few minutes to find the interesting ones:
- the plant list, with current power and daily, monthly, yearly and lifetime yield
- the device list of each plant
- realtime data per inverter: AC power, temperature, frequency, phase voltages and currents
- voltage and current of every PV string
- alarm counts by severity
The exporter signs in like a browser would. It fetches the portal’s public key, encrypts the password with it, posts the login, follows the redirect to the regional portal host, and picks up a session token. After that it polls those endpoints every two minutes and turns the answers into metrics. When the session expires it logs in again.
One thing the portal does not hand over directly is total DC input power, so the exporter calculates it: voltage times current for each string, summed.
Running it
It is one Python file in a small Docker image.
git clone https://github.com/jaba0x/fusionsolar-exporter.git
cd fusionsolar-exporter
cp .env.example .env   # set username and password
docker compose up -d --build
Point Prometheus at port 9850, import the dashboard JSON from the repo into Grafana, and you get power and yield per plant, AC and DC power per inverter, PV strings, phase voltage and current, and alarm counts. Plants and inverters are discovered automatically, so there is nothing to list by hand.
What I learned along the way
- Use a dedicated portal user. If the exporter shares a login with a person, one of them can get logged out. A separate read-only user also keeps your main password out of an env file.
- Be careful with failed logins. A few wrong attempts and the portal starts asking for a captcha. The exporter waits 30 minutes after any failed login instead of hammering it.
- Two accounts can see the same plant. I ran one exporter per account and got every inverter twice on the dashboard. Filtering on the Prometheus
joblabel fixed it. - It is not an official API. Huawei can change the portal whenever they like and break this. That is the price of not needing an API account. If it breaks for you, open an issue.
So far it is tested with SUN2000 string inverters on the EU5 region. Batteries, meters and optimizers are next on the list. If you run it on a different region or with different hardware, I would like to hear how it goes.
The code, the Grafana dashboard and the full list of metrics are on GitHub.
Follow along. New posts show up on the RSS feed. I also share my projects on GitHub, MakerWorld and LinkedIn.